
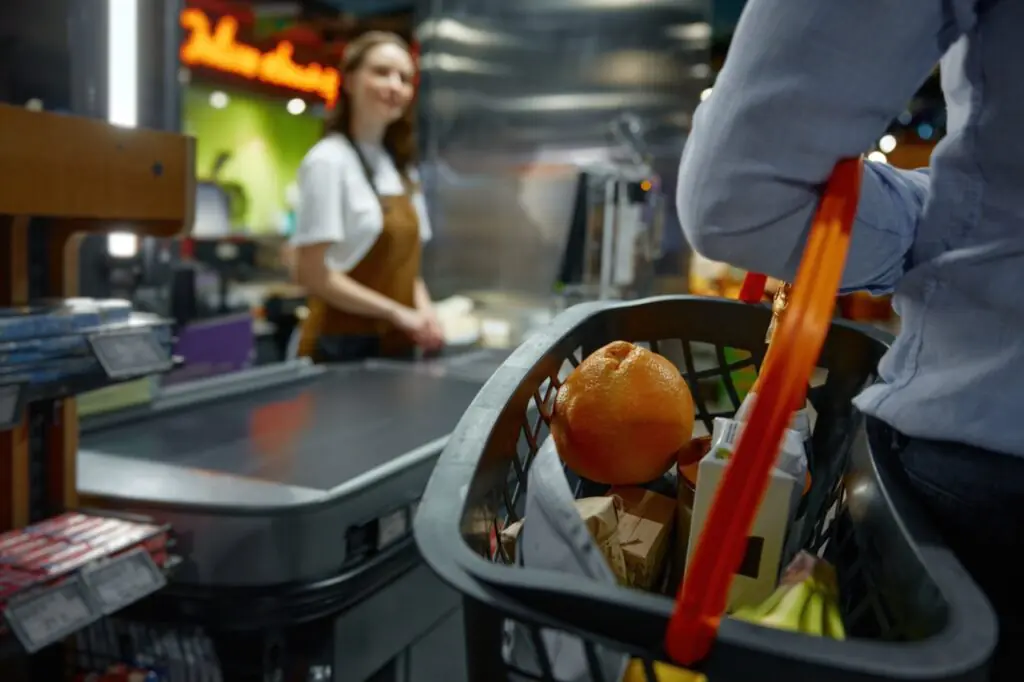
Employee scheduling is one of the most consequential daily management decisions in an independent grocery store, and it is one of the most commonly made on instinct rather than data. Most grocery managers schedule based on a mental model of when the store is busy, shaped by experience and habit, with adjustments for obvious events like holidays and pay periods. The result is usually close enough to work but rarely precise enough to be optimal.
The cost of imprecision runs in both directions. Overstaffing a slow period wastes labor dollars on hours that are not generating proportional revenue. Understaffing a busy period costs you customer experience, checkout speed, and sometimes sales when customers abandon a long line. For an independent grocer operating on tight margins, eliminating both types of waste through data-driven scheduling has a real and measurable impact on profitability.
Your POS system is already generating the data you need to build a significantly better schedule. Here is how to use it.
Understand What Your POS Traffic Data Actually Contains
Every transaction your POS processes is timestamped, which means your system contains a complete record of exactly when customers are shopping at your store, down to the hour and minute, across every day of the week and every week of the year. This data is the foundation of a data-driven scheduling approach.
The specific metrics most useful for scheduling purposes include:
- Transaction count by hour of day, which tells you when customer traffic is highest and lowest
- Transaction count by day of week, which shows your weekly traffic pattern across the full seven-day cycle
- Average transaction time by hour, which tells you not just how many customers are shopping but how complex those transactions are and therefore how much cashier capacity they require
- Department-level activity patterns, which may show that your deli counter peaks at a different time than your checkout lanes and requires staffing calibration separately
FlexRetail’s reporting and analytics platform surfaces all of this data in a format accessible to a store manager who does not have time to build custom analyses. The goal is a weekly review that takes fifteen minutes and tells you what your store’s actual traffic pattern looked like last week compared to the week before and the same week last year.
Map Your Traffic Pattern Before You Build the Schedule
Before adjusting your scheduling approach, spend two to three weeks pulling hourly transaction data to build a clear picture of your store’s actual traffic pattern. Most managers find at least a few surprises when they look at the data carefully for the first time. Common findings include:
- A mid-morning rush on weekdays that is more concentrated and more intense than assumed, driven by shoppers stopping on the way to or from a specific local destination
- A late afternoon peak that starts earlier than the schedule currently accounts for, meaning checkout lanes are understaffed during the first thirty minutes of the actual rush
- A Sunday morning period that is significantly busier than Saturday afternoon, opposite to the scheduling assumption that had been in place for years
- A weekday that is consistently slower than others, receiving the same staffing as busier days based on habit rather than data
These findings are not universal. They are specific to your store, your community, and your location. That specificity is exactly why your own POS data is more valuable than any industry benchmark for scheduling purposes.
Match Cashier Coverage to Transaction Volume
The most direct application of traffic data to scheduling is aligning the number of open checkout lanes to the actual transaction volume at each point during the day. A store that opens three lanes at 8am because that is standard practice, when transaction data shows that volume does not justify three lanes until 10am, is paying for two hours of unnecessary labor every weekday.
Conversely, a store that maintains two lanes during the period when transaction data shows a consistent three-lane volume need is creating checkout delays during a predictable busy window.
Building a lane coverage schedule from your hourly transaction data involves:
- Identifying the transaction volume thresholds that justify each additional lane based on your target checkout wait time
- Mapping those thresholds to your hourly transaction data to identify the times when each lane level is appropriate
- Scheduling cashier shifts to align with those coverage needs rather than with round-number shift start times that may not correspond to actual traffic patterns
- Building in a fifteen-minute buffer before each volume increase so cashiers are in position before the rush rather than catching up to it
Account for Non-Cashier Staffing Needs
Transaction volume data drives cashier scheduling directly, but staffing decisions for other roles require a slightly different analysis. Your deli counter, produce department, receiving dock, and stocking team all have staffing needs that are related to but not identical to your checkout traffic pattern.
Useful data points for non-cashier scheduling include:
- Department-level sales velocity by hour, which tells you when your deli, prepared foods, and specialty departments are busiest and need counter staff most
- Receiving schedule and delivery timing, which determines when you need staff on the dock regardless of customer traffic
- Historical data on when your shelves are most likely to need restocking, which is typically in the hours following your peak traffic periods rather than during them
- Inventory alert patterns from FlexRetail’s inventory management system that show which departments require the most frequent attention during high-traffic periods
Plan for Predictable Traffic Variations
Your baseline traffic pattern is your foundation, but scheduling also needs to account for the predictable variations that overlay that pattern on a weekly and seasonal basis. Using your POS historical data, identify:
- Which weeks of the year are consistently higher or lower than your baseline, and by how much, so you can plan staffing levels ahead of predictable surges rather than reacting to them
- Which local events, school calendar dates, and community observances drive traffic increases that require temporary staffing adjustments
- How your traffic pattern shifts between summer and school-year schedules, which often requires a meaningful reconfiguration of your weekday hourly coverage
The event calendar approach described in the inventory planning section of this content applies equally to scheduling. An event that drives a 30% traffic increase requires proportionally more cashier coverage, and that coverage needs to be scheduled in advance rather than scrambled together when the rush materializes.
Use Scheduling Efficiency to Reinvest in Customer-Facing Roles
One of the practical benefits of data-driven scheduling is that the labor dollars saved by eliminating unnecessary overstaffing during slow periods can be reinvested in better coverage during your actual peak periods. This is not necessarily a cost reduction exercise. It is a reallocation exercise that improves both labor efficiency and customer experience simultaneously.
A store that right-sizes its slow-period staffing can afford to add a dedicated express lane cashier during the after-school rush, a second deli counter associate during the Saturday morning peak, or a customer service floater during the busiest checkout windows. These additions are funded by the inefficiency that precise scheduling eliminates elsewhere in the schedule.
FlexRetail’s reporting tools give you the hourly and day-of-week data to make these scheduling decisions confidently rather than arguing about them based on competing intuitions. Schedule a demo to see what your store’s traffic data would look like inside the platform and how the reporting tools support a weekly scheduling review workflow.